

Model and lineage
See how your tables relate and what depends on what before you change anything.
Model
The Model canvas draws your tables and the relationships between them, including across databases.
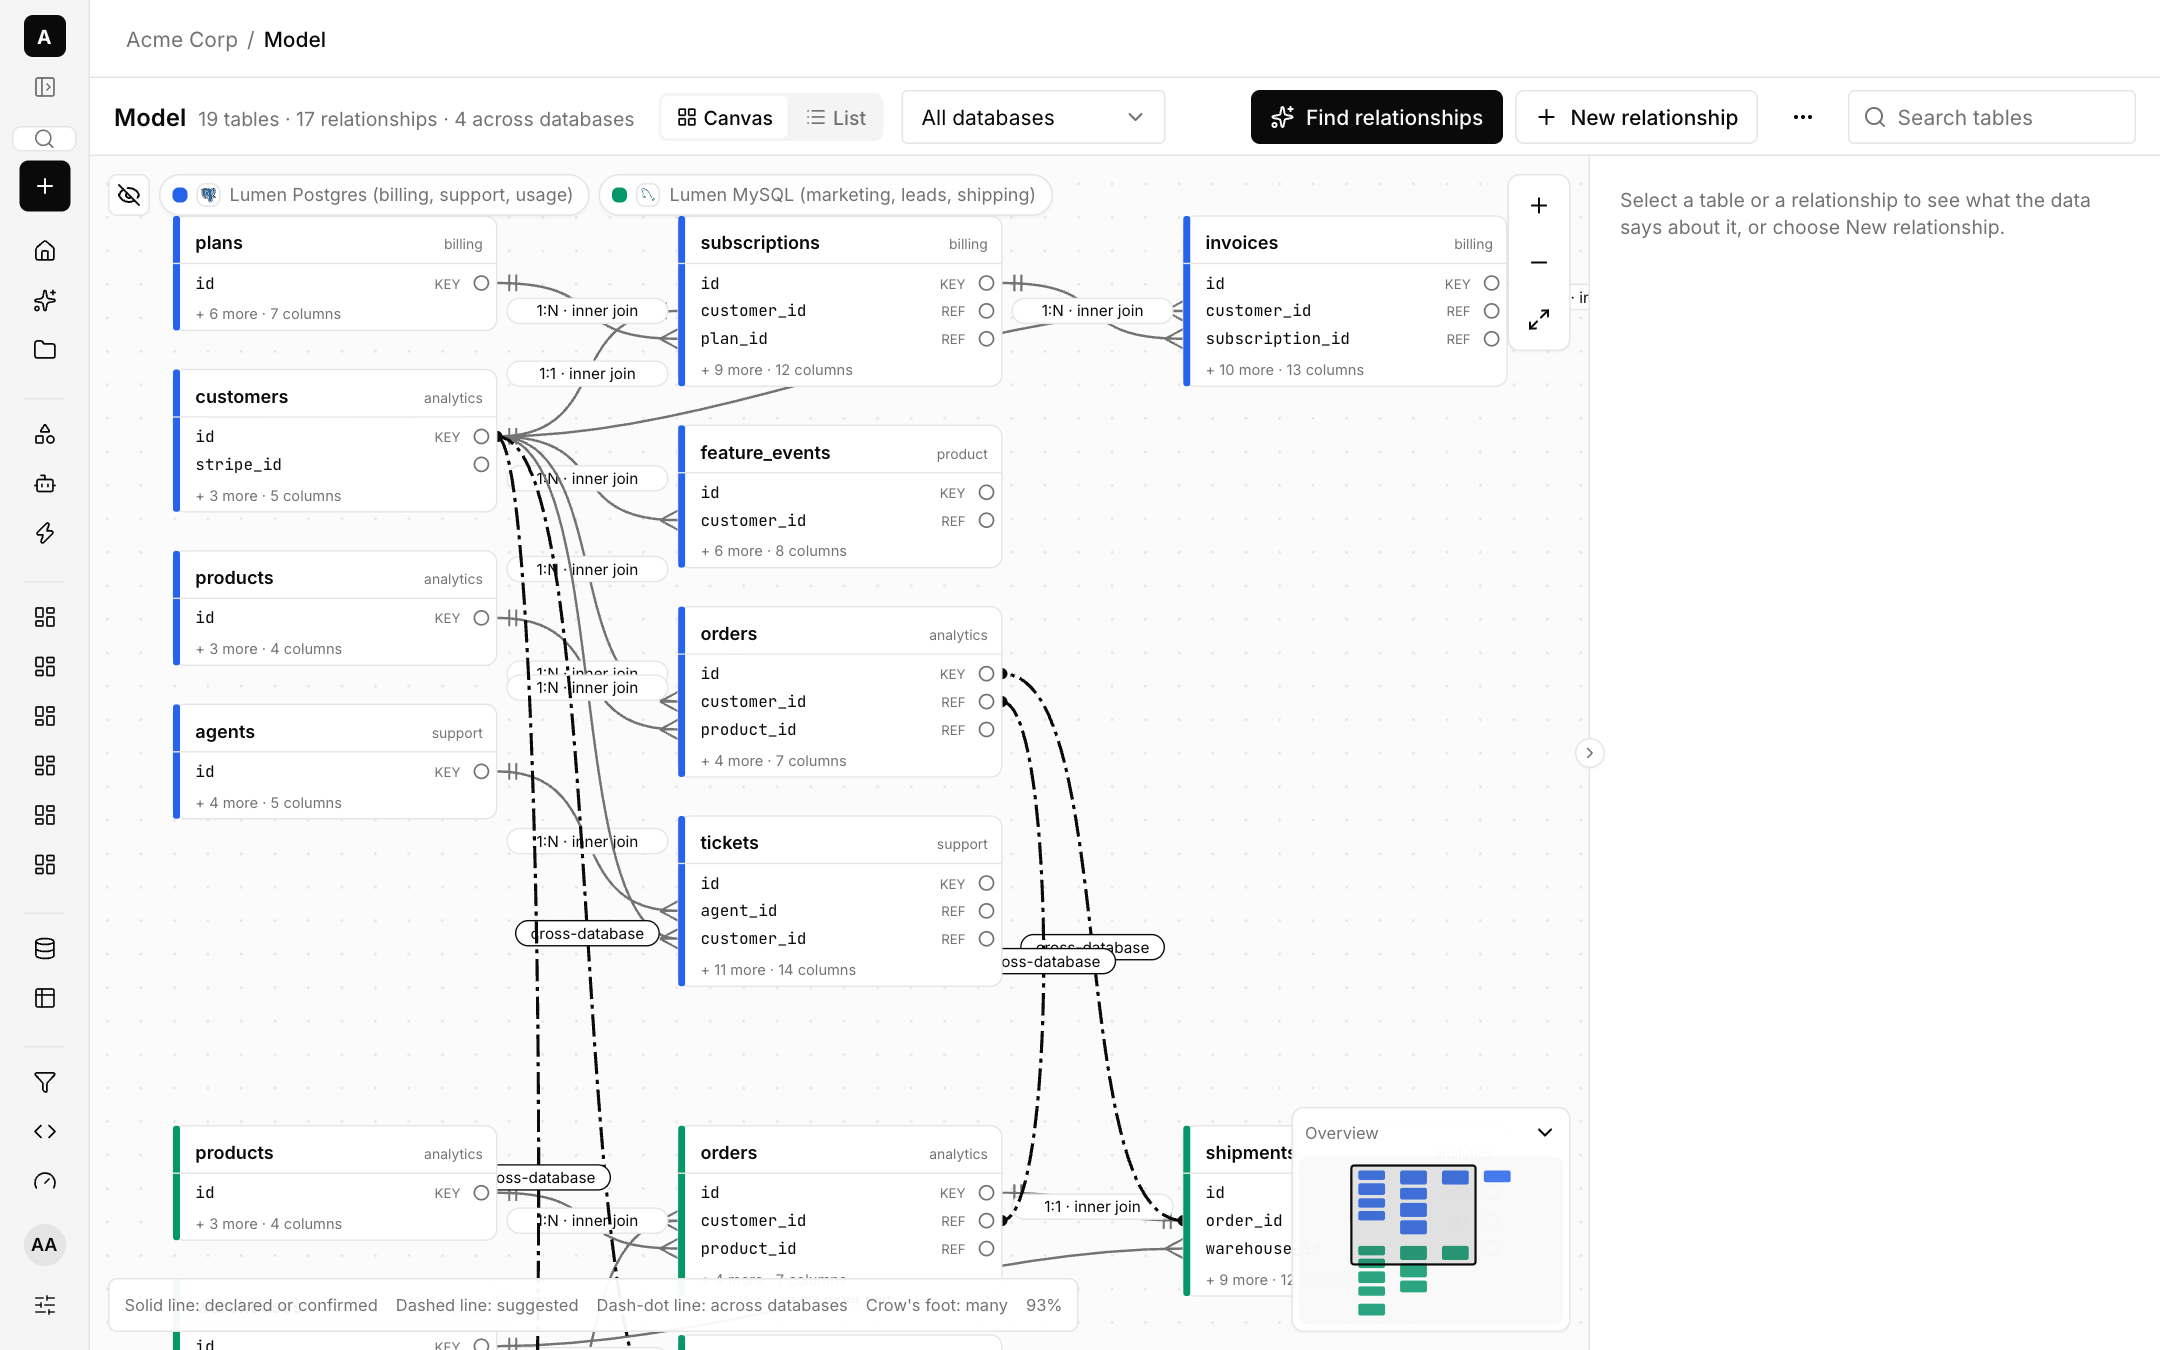
- Lines show the type of relationship: a solid line is declared or confirmed, dashed is suggested, and dash-dot spans databases. A crow's foot marks the many side.
- Health is measured from your data: match rate, orphans, duplicate keys and fan-out, as counts only.
- Find relationships suggests relationships. Accept or reject each one, or choose New relationship to draw your own.
- Select a table or relationship to see what the data says about it, and preview joined rows. Previews follow your access rules.
- Use List for a phone-friendly view.
Lineage
Lineage shows what depends on what, and what breaks before you change it.
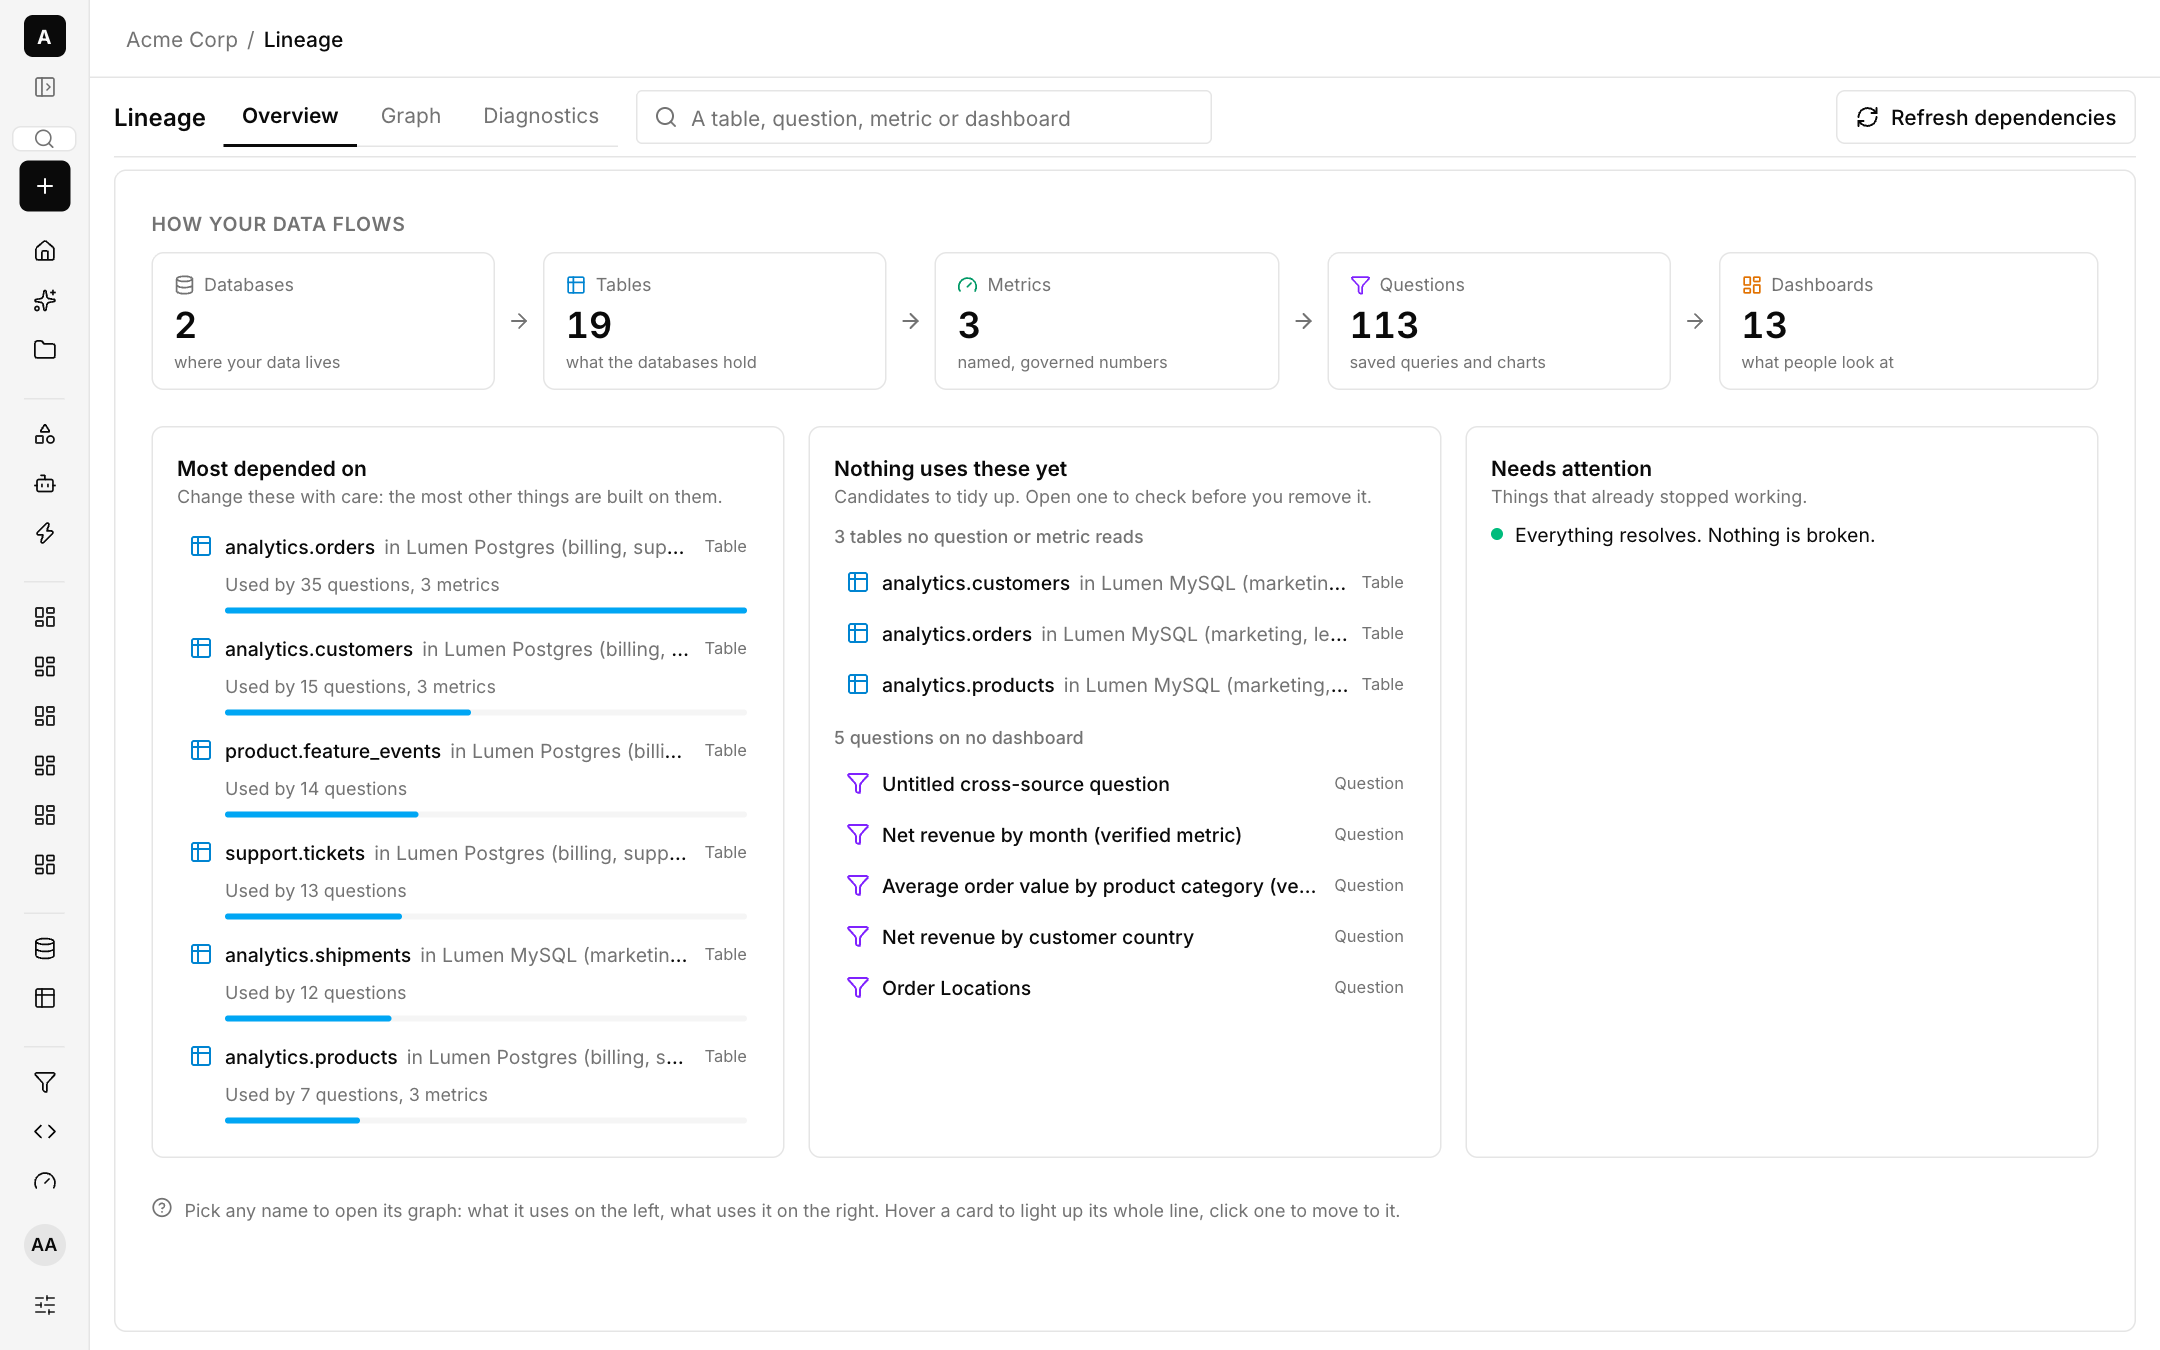
- Overview counts databases, tables, metrics, questions and dashboards, lists what is most depended on, and shows candidates to tidy up.
- Graph shows what an item uses on the left and what uses it on the right. Hover to light up its line and click to move to it.
- Diagnostics lists things that have stopped working. Choose Refresh dependencies to rebuild.
Dependencies are recorded when you save or delete questions, dashboards, alerts, subscriptions and metrics. SQL that cannot be read is recorded as unknown, never guessed.