
Dashboards
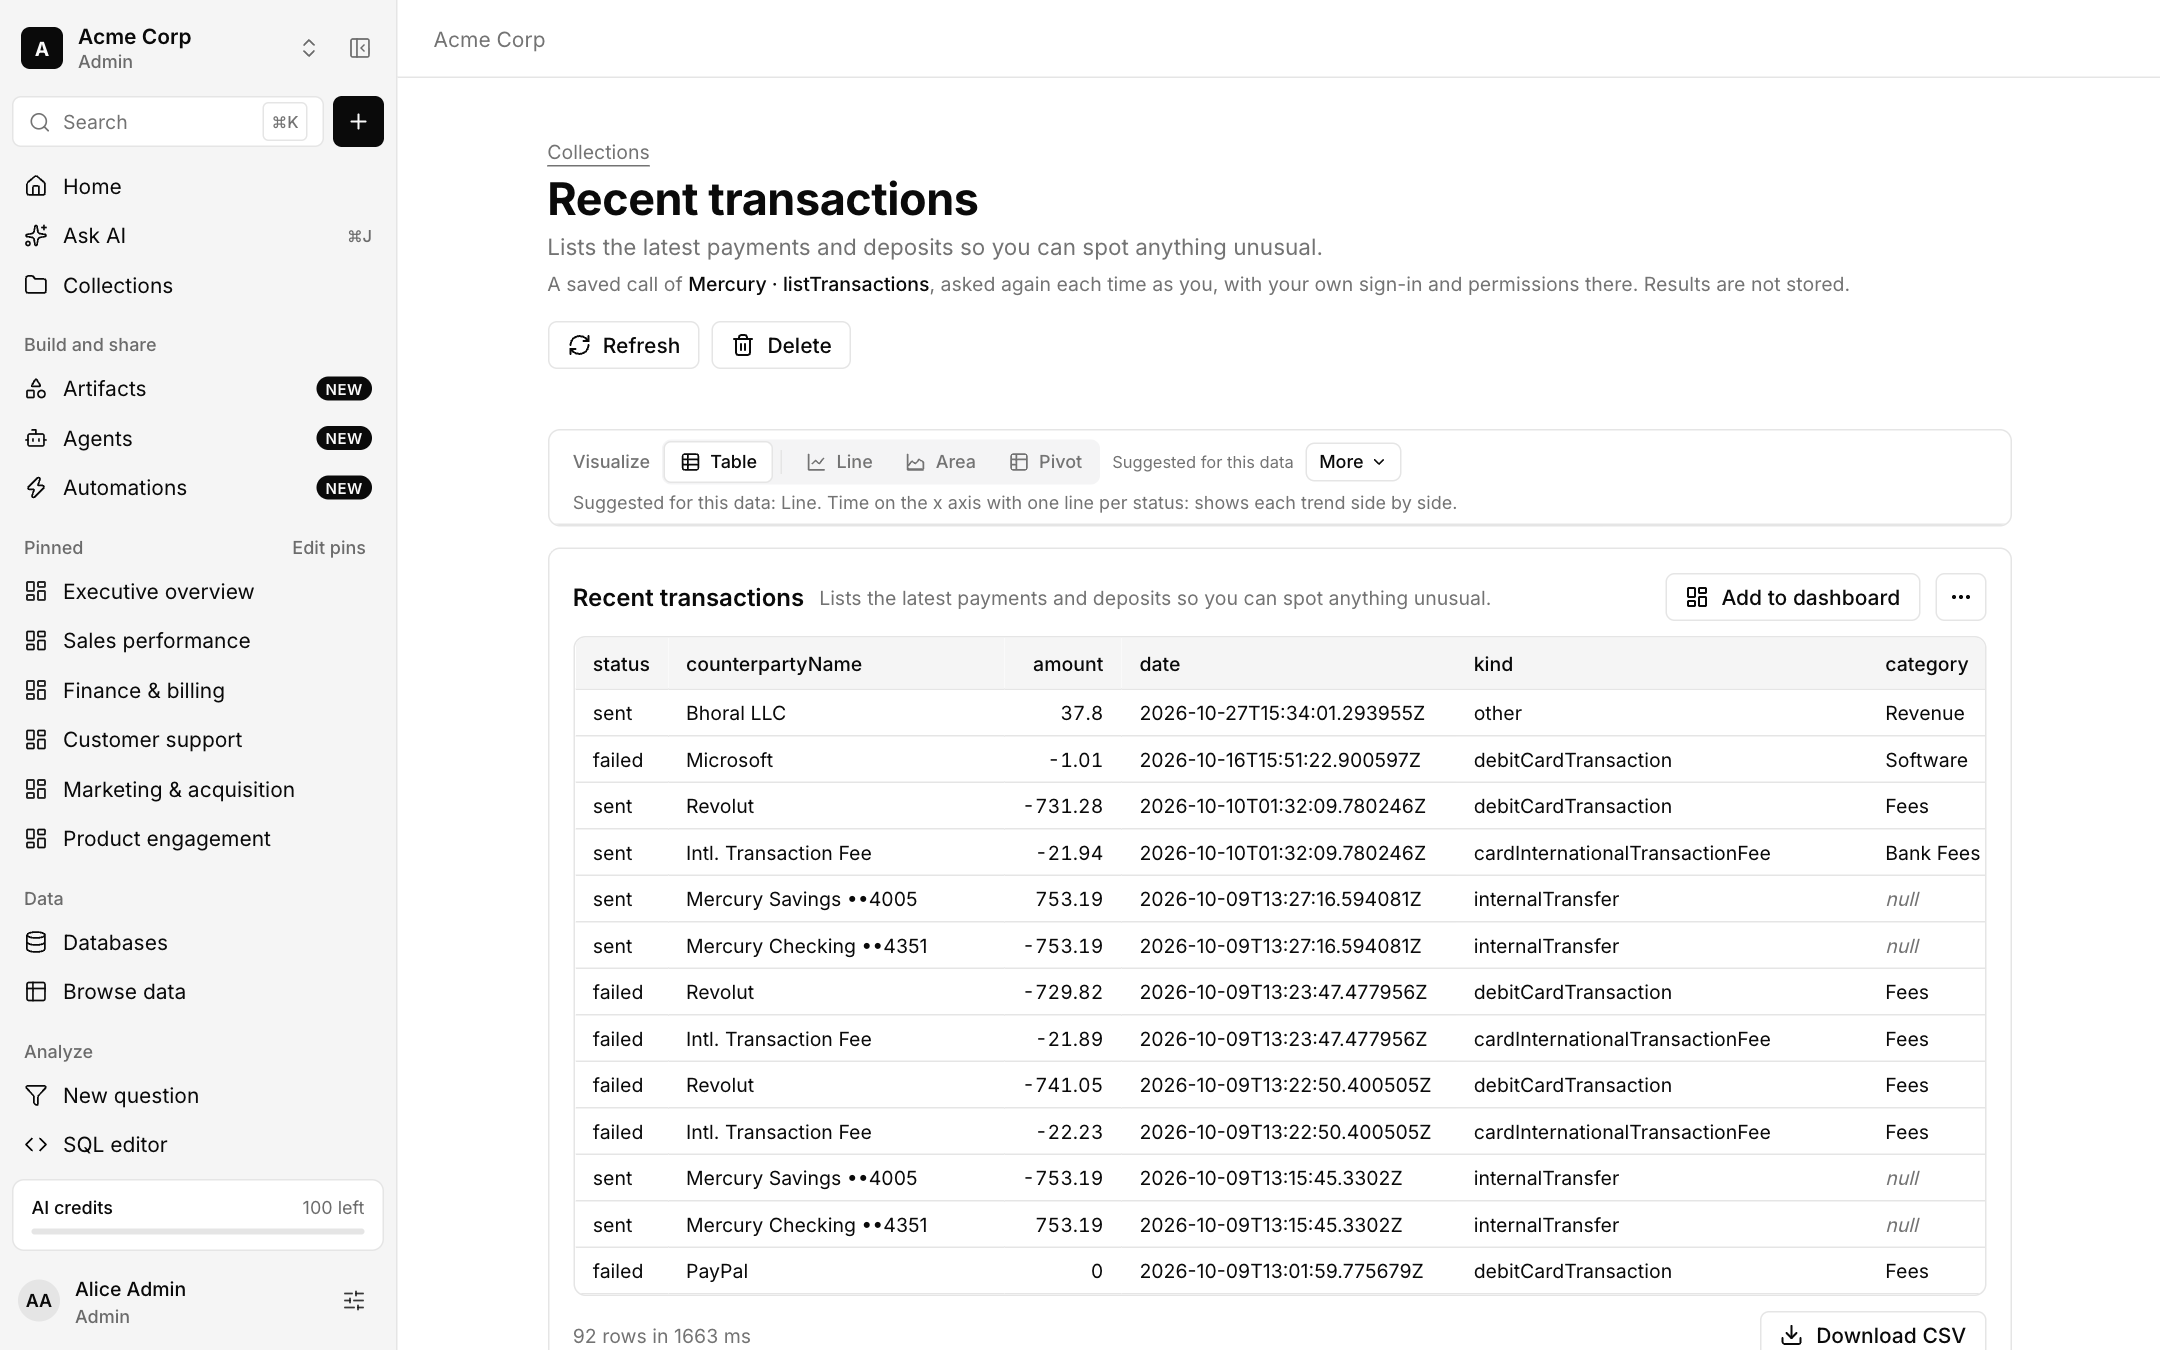
Arrange answers on a dashboard with filters, summaries and sharing.
A dashboard is a set of cards, each backed by a saved question, arranged on a grid with shared filters.
Use a dashboard
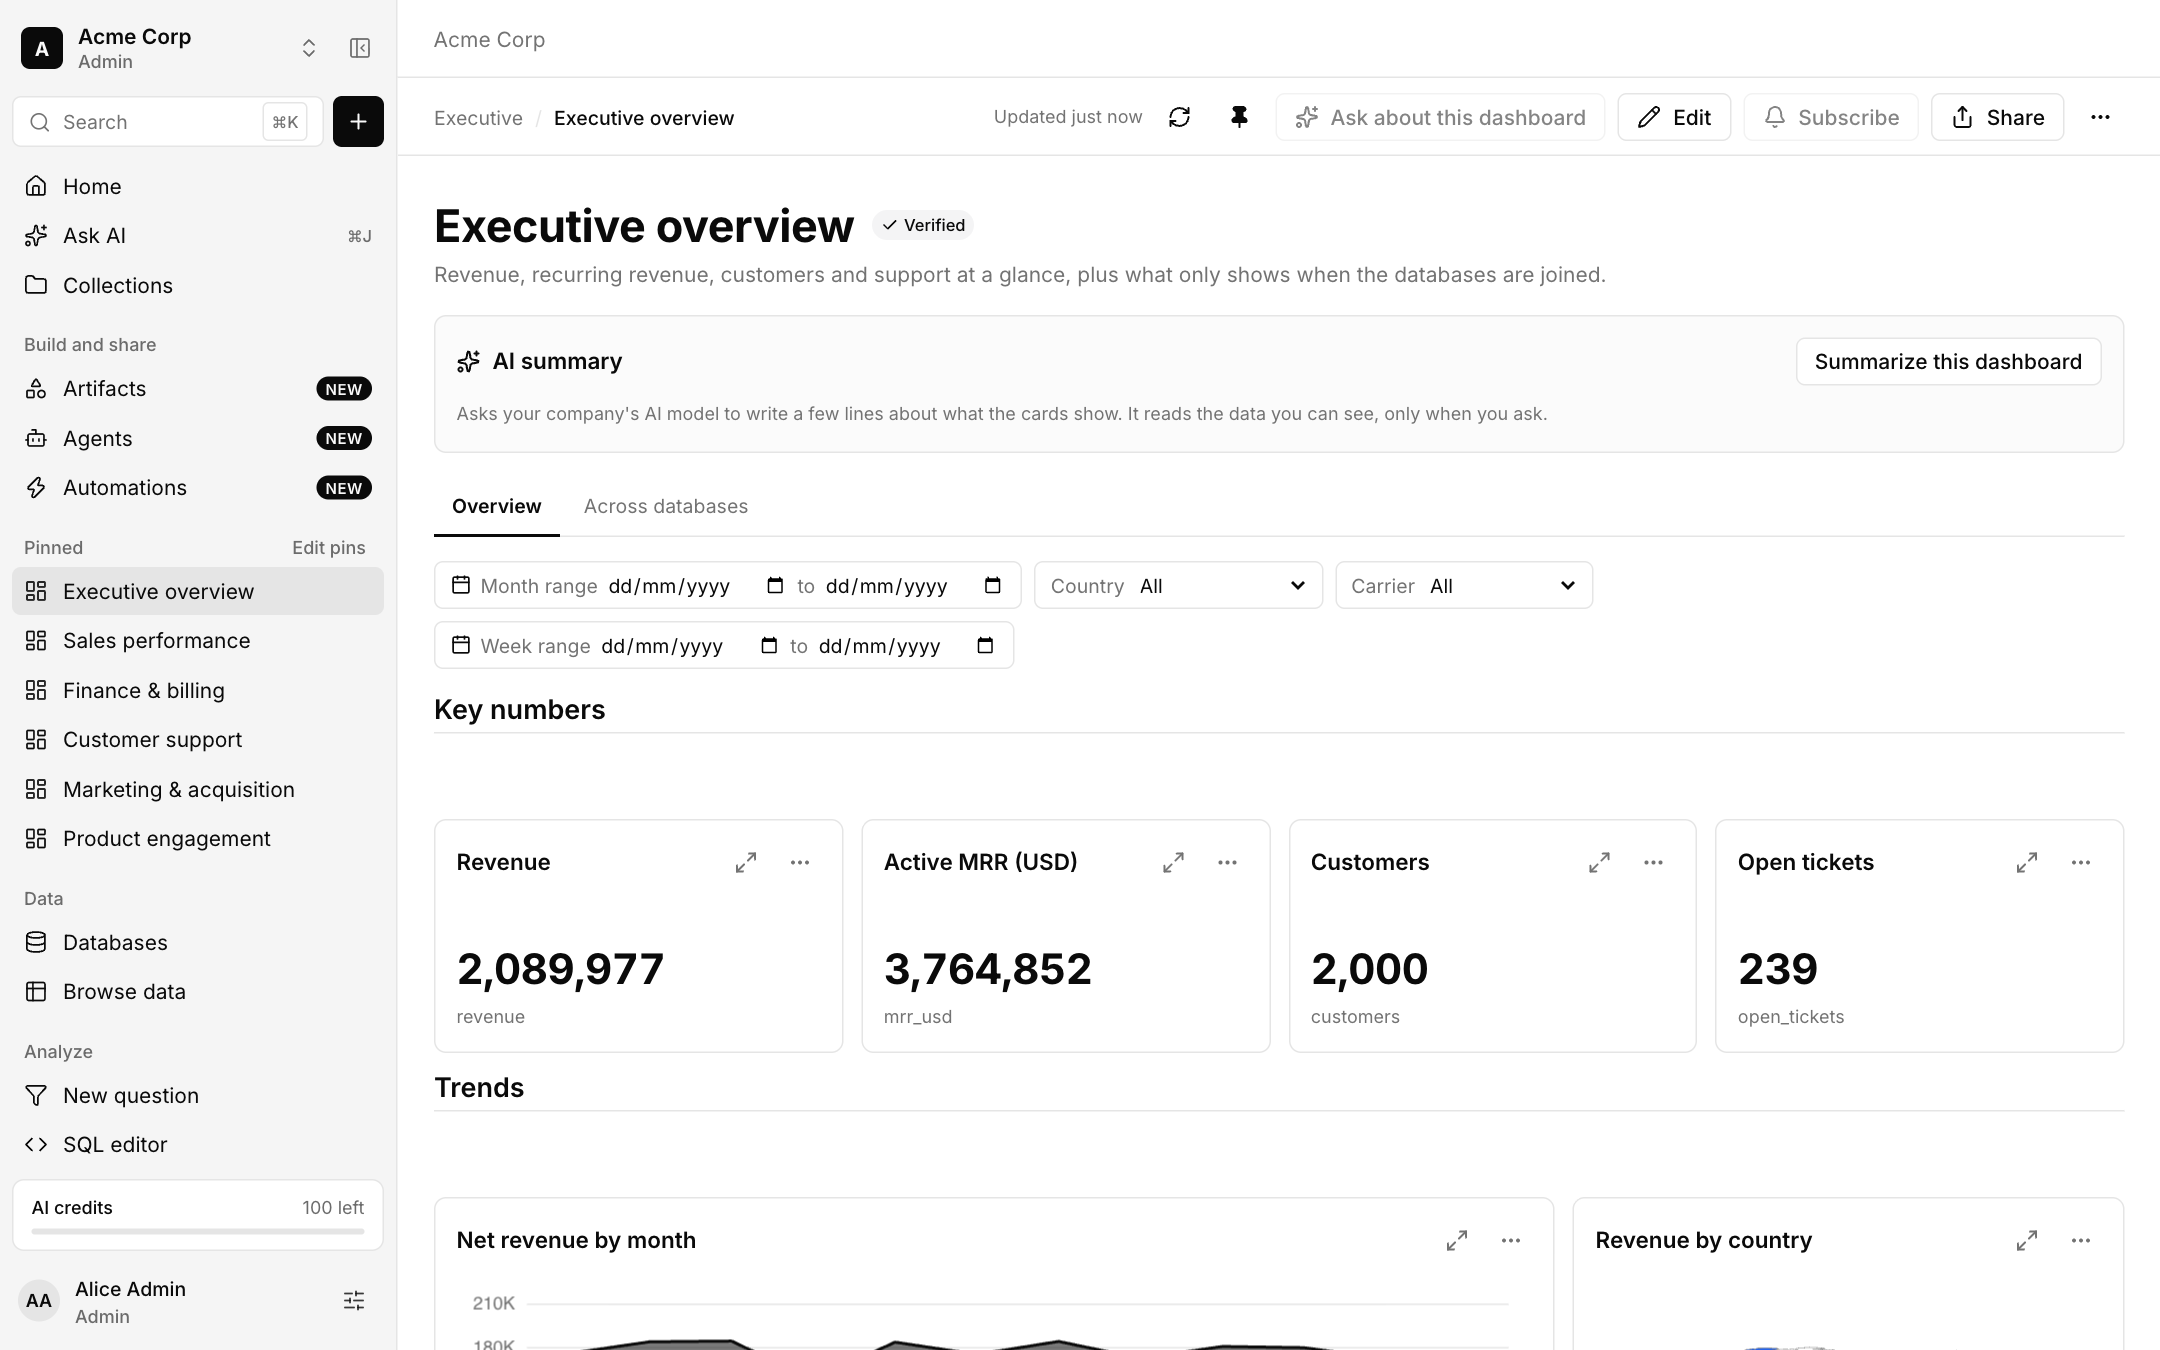
- Filters at the top apply to the cards that use them, for example a month range, country or carrier.
- Tabs split a dashboard into sections, such as Overview and Across databases.
- The Verified badge shows that the dashboard has been checked.
- Ask about this dashboard opens Ask AI with the dashboard as context.
- AI summary: choose Summarize this dashboard to ask your company's AI model to write a few lines about what the cards show. It reads data you can see, only when you ask, and nothing is stored.
Build and edit
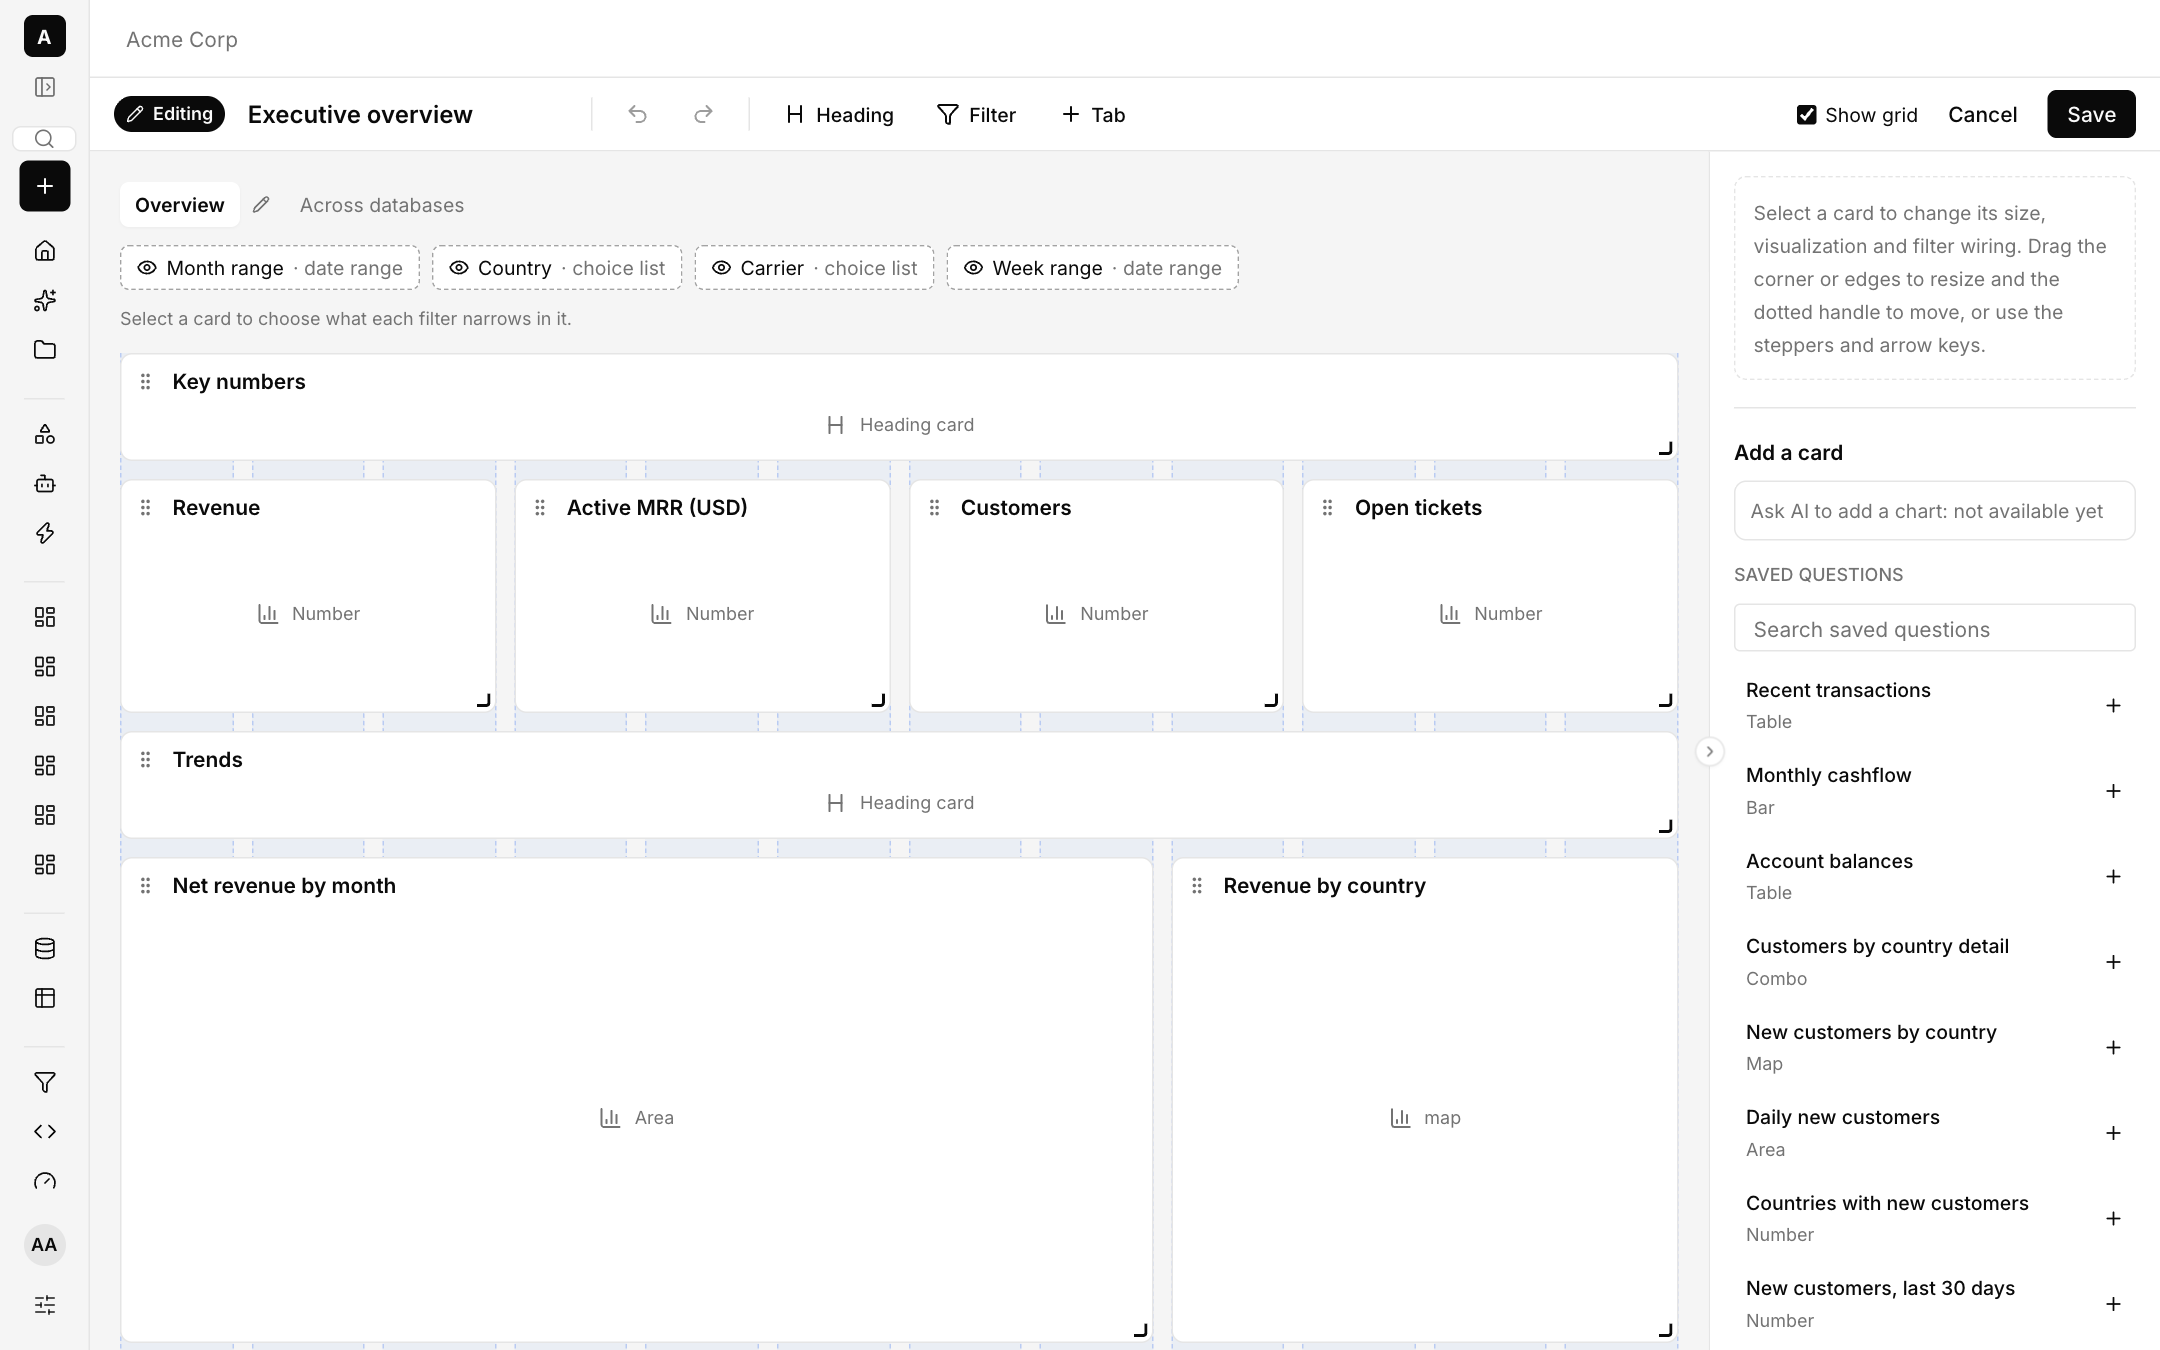
Open a dashboard and choose Edit, or create one from a question with Add to dashboard.
Add saved questions as cards, then drag and resize them. Set filters that apply across cards.
Save, then share it or subscribe to it.
Saved questions
Every card is a saved question. Open one to see its chart, its SQL and what it depends on.